Customising views in the GA4 dashboard.
GA4 – many of you will have dutifully set up your GA4 property now in preparation to the switchover – which is officially happening in July 2023.
We commend your efforts and you will now be collecting the base data if you have turned on enhanced measurements – We would recommend going to or setting up a GTM container and implementing a series of tags triggers and associated custom parameters to ensure your site events are recorded in manner that is useful to you.
However, many are still struggling to get to grips with the reporting – firstly, I would recommend that if your property has just been set-up – I would suggest leaving it well alone for a period of 7 days – it takes 24 hours or from midnight for the previous days events to show in reports and therefore the debug view is the most important when it comes to ensuring the events are firing correctly when initially setting up – you will also benefit from the real-time view which will record even new events within that window – they just won’t show up in the reporting views until the following day.
So when a period of 7 days has elapsed without too much intervention, debugging and checking you should be able to see which events look shy or perhaps do not correlate properly by selecting the configure tab and looking at the overall events and users table – you may need to issue some tweaks and additional rules or variables if using GTM tags and triggers.
Once the data is starting to look accurate you are ready to start reporting from GA4 and you are in the nice position of having 11months to utilise and tailor your dashboard before UA disappears – wise move indeed!
Book in your Free 30min GA4 consultation today!

So, here are a couple of my most useful top-tips for customising dashboards and report settings in GA4.
First up – Each of your events – if set up in GTM can also send through really useful information along with the recorded event – however, you will have needed to specify this to whoever was setting up your event tag in GTM – for example in forms – you could record not only every time your contact form was submitted but also if you have a drop-down within that form for the type of product/service of interest – you could also record that information along with the event and this would show in the event panel.
Posts views events – in context of the categories, tags and authors of those posts.
– again, this event information would look something like this when the additional fields are set to record these data layers from GTM.
If you are finding that a number of the charts – such as the gender split (the donut chart in the screenshot here) are not displaying data then I would suggest you go to your GA4 property admin panel and select set-up assistant, in the first screen you will notice – a title – Turn on Google Signals
What is Google Signals?
It is data that google can attribute to those google account holders, who are signed into their account and have also opted to have ads personalisation. This enables cross-device reporting, re-marketing and google ads conversion export.
You may find the following resource helpful –
Google Support – Google Signals
I am currently in two minds as to how useful this information is – however, when taking these charts in the context of those that would like to have personalised ads – the information is useful – just an important distinction to make that these charts are by no means, a full representation of all your site users.
The data is not shared and neither can you share it beyond the google GA4 dashboard.

Altering Table data in your GA4 Dashboards – adding Metrics to reports
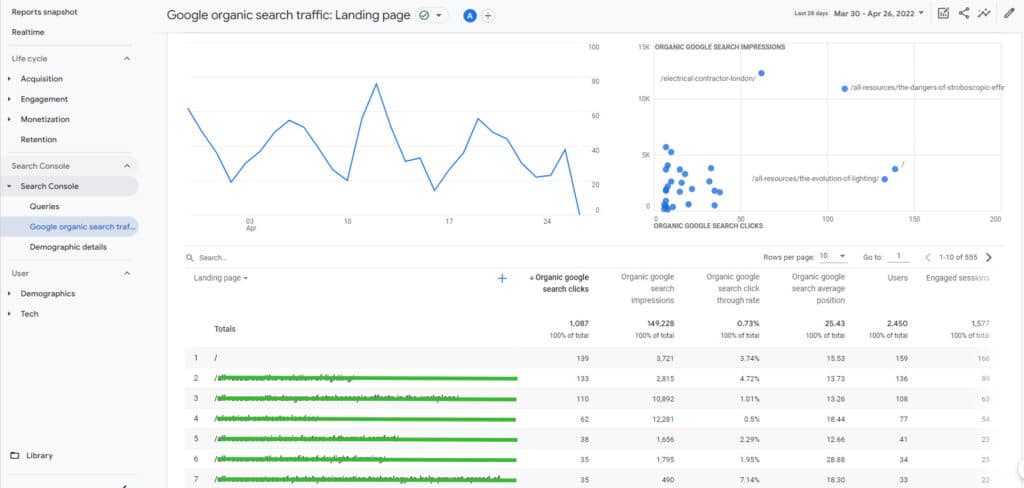
If you are looking to alter the table data in GA4 this can be done quite simply by going to the dashboard – selecting reports and then in this example – selecting engagement and then selecting pages and screens – in the top right you will notice a pencil icon which allows you to customise the report.
If you select metrics you will see a drop-down with a number of options you can add – you can simply drag-and-drop the metric to feature in the position required.
Other useful features
Other things that may prove useful to you when getting to grips with the GA4 dashboard are the search bars –for example in the acquisition and traffic report you may wish to know where the referral traffic is coming from. This information can be obtained by navigating to the Acquisition report and then further selecting the traffic acquisition tab.
If you select medium/source you will get a list of source and medium of the traffic – if you then type referral into the search bar just above the table you will further filter just to see the traffic by referral and the referring site.
You can also do this on the user acquisition tab and there – filter on first user information.
Book in your Free 30min GA4 consultation today!